
🌍 Environmental Impact FerayPro
Real-time traceability of recycled waste in USA
12
Batches traced
14 233 lb
Waste to recycle
5.28 t
CO₂ avoided (recycling)
24.17 t
CO₂ produced (recycling)
🔬 Pollutant Exposure Risk Reduction Indicators
Estimated pollutant diversion from informal recycling — Sources: WHO · Pure Earth · EPA · UNEP
0.03 kg
Lead diverted (est.)
Estimated exposure risk reduction (WHO — no safe threshold)
12.5 kg
PM2.5 diverted (est.)
Respiratory exposure risk proxy (avoided cable burning)
0 g
Cadmium diverted (est.)
Renal risk reduction proxy (e-waste, batteries)
0 g
Mercury diverted (est.)
Neurological risk reduction proxy (screens, lamps)
Exposure Risk Reduction Index : 89
Estimative proxy based on WHO and HEI exposure thresholds — not clinically validated, field validation planned Phase 2
* Conservative estimates based on global emission factors (WHO, Pure Earth, EPA). These indicators represent an estimated pollutant exposure risk reduction — they do not constitute causal clinical impact attribution. Field validation and ML refinement planned for Phase 2.
Recently traced batches

Heavy scrap metal
Denver CO 80202 · 3 000 lb
🌱 1.497 t CO₂ avoided
FP-2075A002

Mixed scrap metal
Indianapolis IN 46204 · 25 lb
🌱 0.013 t CO₂ avoided
FP-EC7D5C02
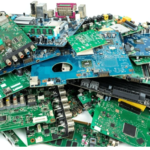
Mixed High-Grade Printed Circuit Boards
Chicago IL 60609 · 10 lb
🌱 0.016 t CO₂ avoided
FP-BA310798
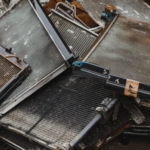
Dirty radiators
San Diego CA 92121 · 55 lb
🌱 0.027 t CO₂ avoided
FP-BC1985B0

Mixed yellow and red brass
Phoenix AZ 85043 · 22 lb
🌱 0.001 t CO₂ avoided
FP-15FC27DF
Emission factors : ADEME Base Carbone · Open Source MIT · feraypro.com/impact
RECYCLING PARTNERS
MARKETING PARTNERS